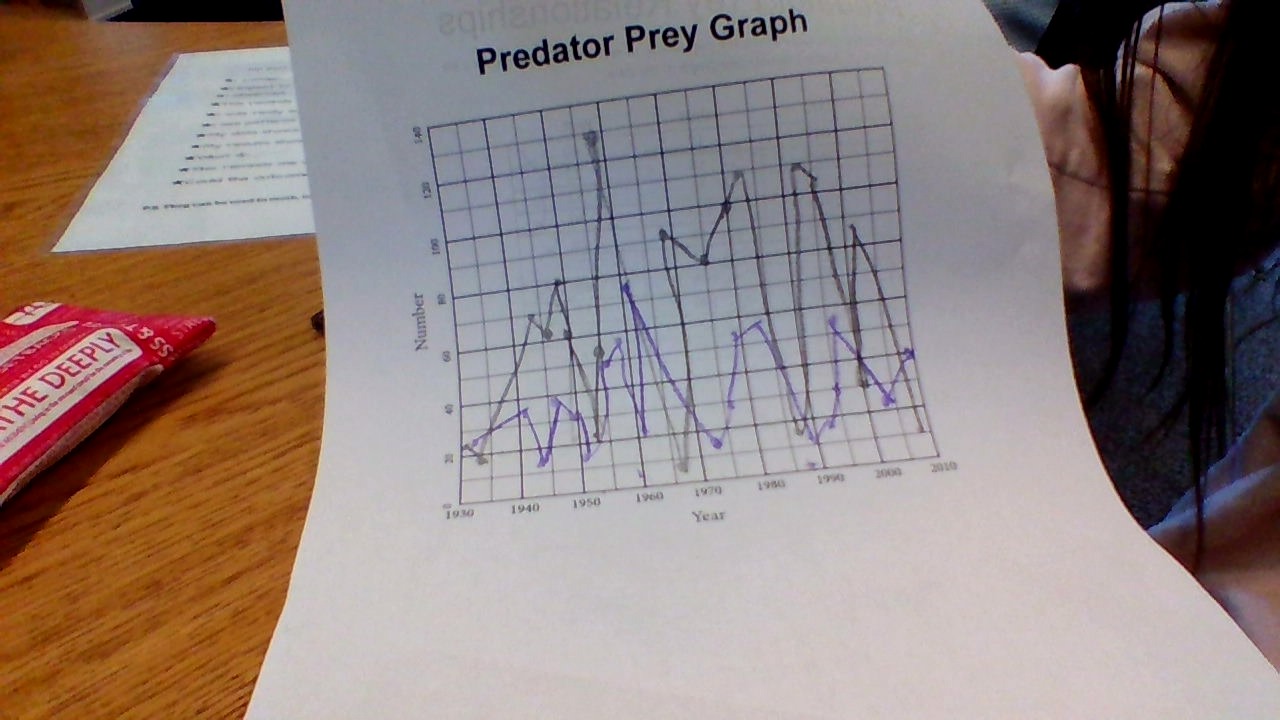
*Explain the trend of increases and/or decreases for both the rabbit and wolf populations between the years 1930-1950. The wolves are eating the rabbits but the rabbits can’t do anything because there is less rabbits to have more rabbits.
*Look at the years 1987 and 1993. Explain your thinking as to why there is such a large difference in population numbers between those five years? The There is a large difference because there are less wolves to eat the rabbits
*Analyze the population changes between 2000-2005. The wolves are eating the rabbits