Q and A on Graph:
Explain the trend of increases and/or decreases for both the rabbit and wolf populations between the years 1930-1950.
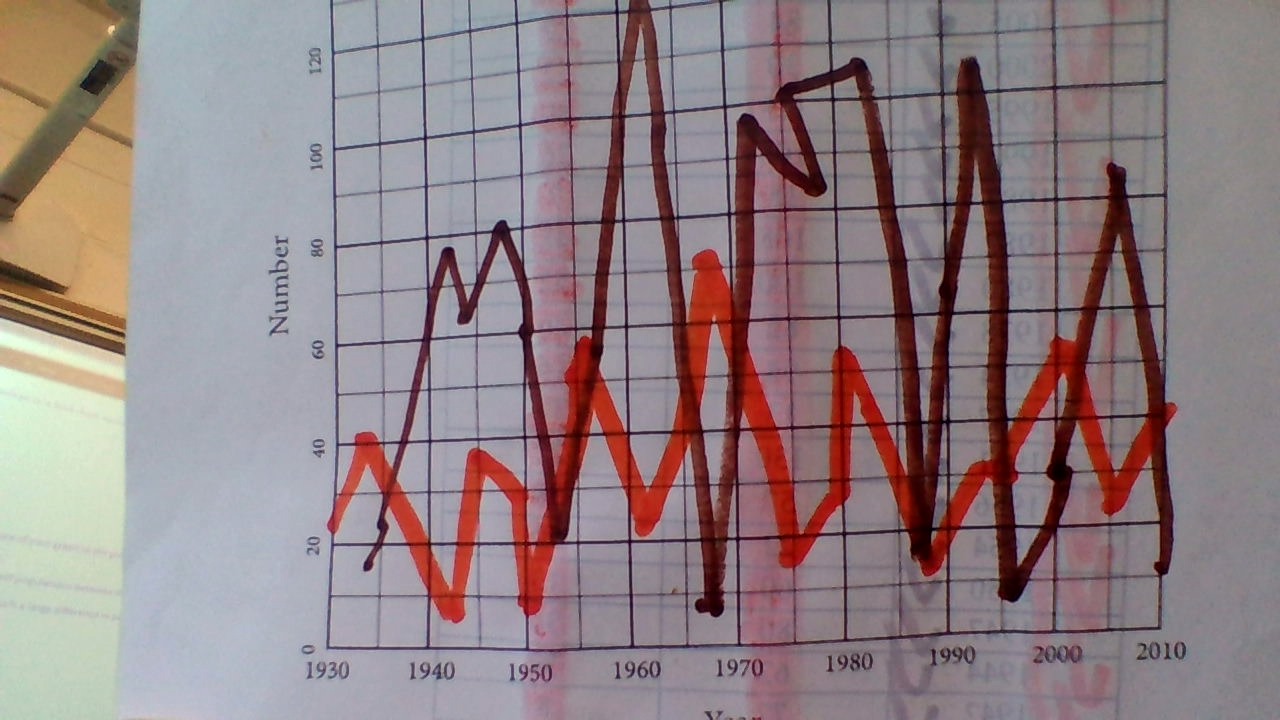
The populations of wolves from 1930-1950 was about between 0 and 40.40 was the highest the population ever got between that time period.It really changed around the time of the 1940’s.It went down by about 30 or 35. That’s where it mostly changed!
The populations of rabbits from 1930-1950 was between 0 and 80.80 was the highest the population ever got between that time period.It really changed and went up around 1935.It went up by about 60 around 1950.That’s where it mostly changed!
Look at the years 1987 and 1993. Explain your thinking as to why there is such a large difference in population numbers between those five years.
Maybe it’s because other animals didn’t have food or enough food and they went to go search down Rabbits or Wolves to eat because they were one of the only animals that they could eat and or one of the only animals left?!
Analyze the population changes between 2000-2005.
For the Rabbits in 2000 it went up from about 10 to about 30.Then in 2005 from about 30 it went up to about 85.
For the Wolves at 2000 it went from about 30 to about 50.Then in 2005 it went from about 50 and went down to about 23 or 24.
Here is a Picture of the Graph: